Here is a little update on my nerdy activities. The CDC does respiratory disease surveillance in 2 areas, Quetzaltenango and Santa Rosa. From that data, I can figure out a crude rate of influenza infections in each of those areas. Using some of the formulas below, I extrapolate that information to the other areas of the country. The result is a pretty map with some colors, which should be taken
cum grano salis.
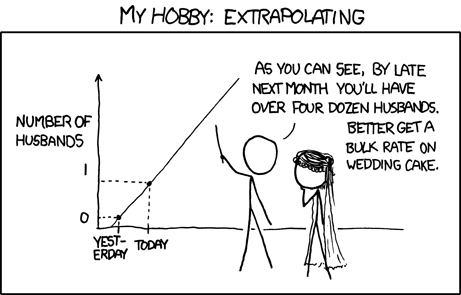
Obviously, there can be some serious problems with extrapolation...


I don't know whether to laugh (at the cartoon) or cry (at the graphs that make me feel stupid!)
ReplyDeleteHasn't the media taught you that you can never extrapolate too far?
ReplyDelete